Credit Profile
Our Temasek Credit Profile is a snapshot of our credit quality and financial strength. For these ratios, the lower the percentage, the higher the credit quality.
Jump to
(for year ended 31 March)
Total Debt
6%
of Net Portfolio Value
- Total Debt
- Net Portfolio Value
Total Debt
21%
of
Liquid Assets
- Total Debt
- Liquid Assets
Interest Expense
5%
of Dividend Income
- Interest Expense
- Dividend Income
Interest Expense
1%
of
Recurring Income
- Interest Expense
- Recurring Income
Total Debt due in One Year
5%
of
Recurring Income
- Total Debt due in One Year
- Recurring Income
Total Debt due in next 10 Years
24%
of
Liquidity Balance
- Total Debt due in next 10 Years
- Liquidity Balance
As an investment company, our divestments, dividends from our portfolio and distributions from funds are used to make investments, fund business expenses, as well as pay interest and principal to bond investors, taxes to tax authorities, and dividends to our shareholder.
For the year ended 31 March 2023, Temasek made S$27 billion of divestments, which include fund distributions, and earned S$11 billion in dividend income. These amounts formed the bulk of our recurring income.
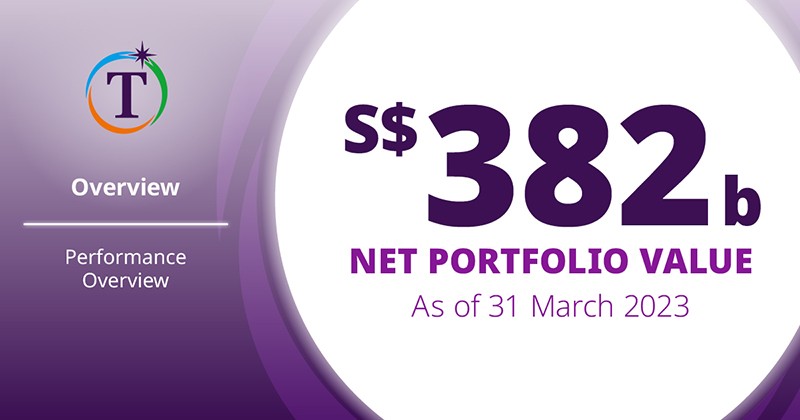
Temasek had S$22 billion of debt outstanding as at 31 March 2023, representing 6% of our net portfolio value.
Our interest expense for the year ended 31 March 2023 was about 5% of our dividend income.
As part of our T2030 strategy, we aim to build a resilient and forward looking portfolio. We maintain sufficient access to liquidity to not only serve as a buffer against shocks in this uncertain environment, but also to allow us to take advantage of investment opportunities, so as to deliver sustainable returns over the long term. We invest in high-quality assets that generate recurring income to provide us with strong and stable liquidity. We also maintain the discipline of regular divestments to generate liquidity.
Our portfolio enables us to tap into liquidity in times of stress. As at 31 March 2023, our liquid and sub-20% listed assets alone were about five times our debt outstanding. In the very unlikely extreme scenario where we have no other cash inflows, aside from using our liquidity balance, divesting a small part of our liquid and sub-20% listed assets would be sufficient to cover the total debt outstanding in under two weeks.
Key Credit Parameters (in S$ billion)
| For year ended 31 March | 2019 | 2020 | 2021 | 2022 | 2023 |
|---|---|---|---|---|---|
| Divestments | 28 | 26 | 39 | 37 | 27 |
| Dividend income | 8.5 | 11.9 | 8.4 | 9.4 | 11.1 |
| Income from investments | 0.4 | 0.8 | 0.7 | 1.0 | 0.9 |
| Interest income | 0.4 | 0.7 | 0.1 | 0.1 | 0.6 |
| Interest expense | 0.4 | 0.4 | 0.4 | 0.5 | 0.5 |
| Net portfolio value | 313 | 306 | 381 | 403 | 382 |
| Liquid assets | 112.2 | 112.4 | 143.1 | 113.6 | 104.5 |
| Liquidity balance | 44.2 | 47.1 | 50.8 | 38.4 | 43.7 |
| Total debt | 15.1 | 13.9 | 17.6 | 22.0 | 21.7 |


