Chart Centre
See our key financial metrics and diagrams.
Jump to
-
Performance Overview
-
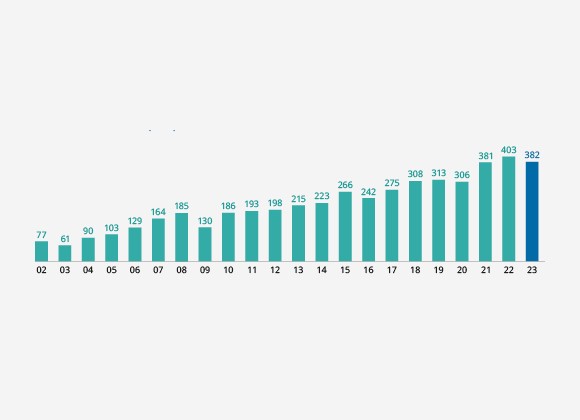
Net Portfolio Value (S$b)
-
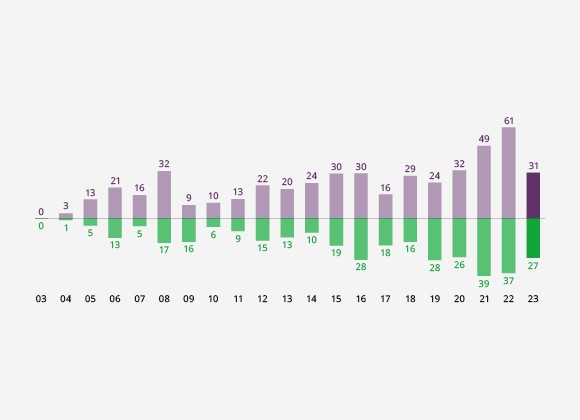
Investments & Divestments (S$b)
-
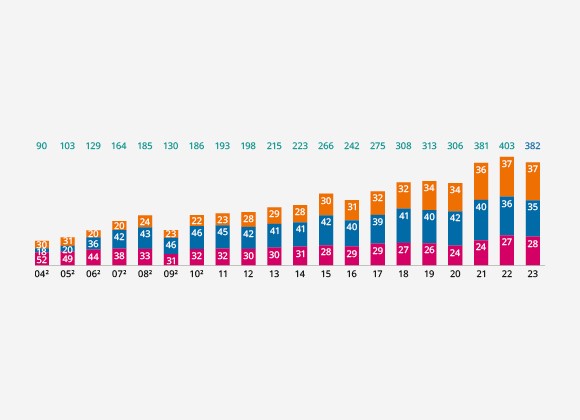
Portfolio by Geography (%)
-
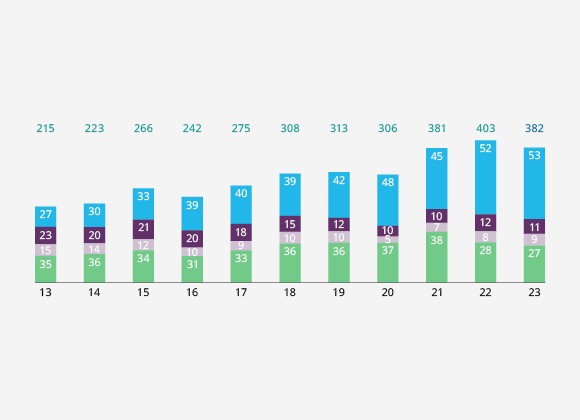
Portfolio by Liquidity (%)
-
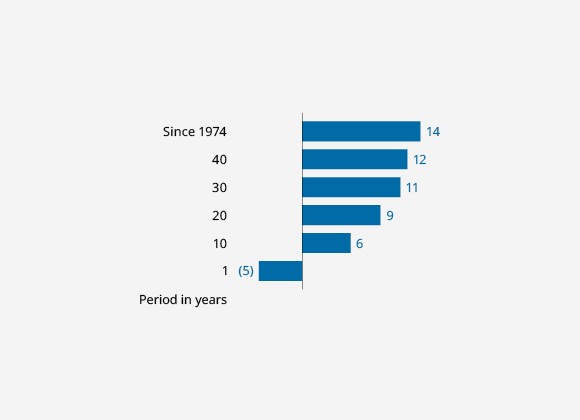
S$ Total Shareholder Return (%)
-
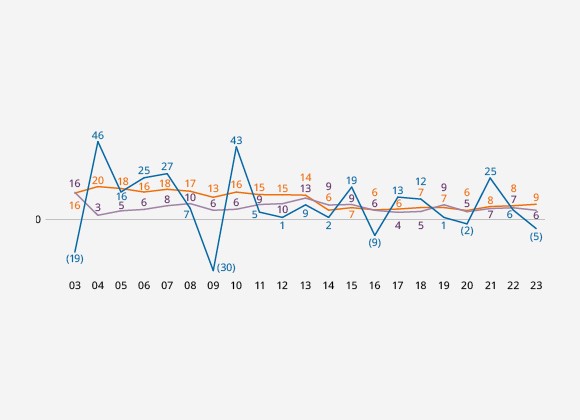
Rolling S$ Total Shareholder Return (%)
-
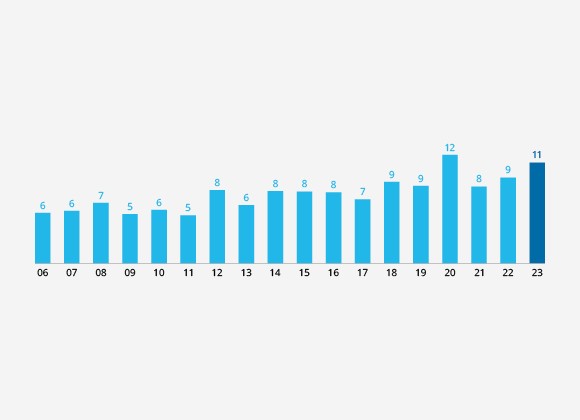
Dividend Income (S$b)
-
-
Portfolio Highlights
-
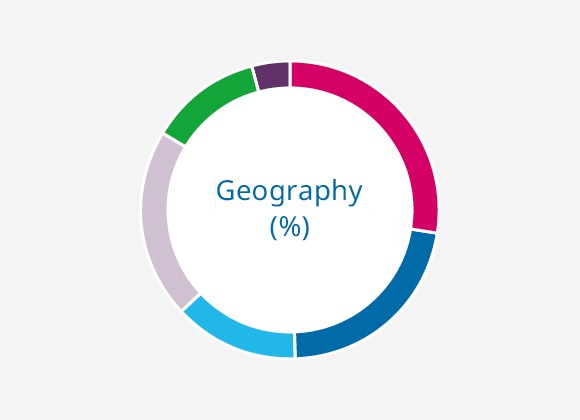
Geography (%)
-
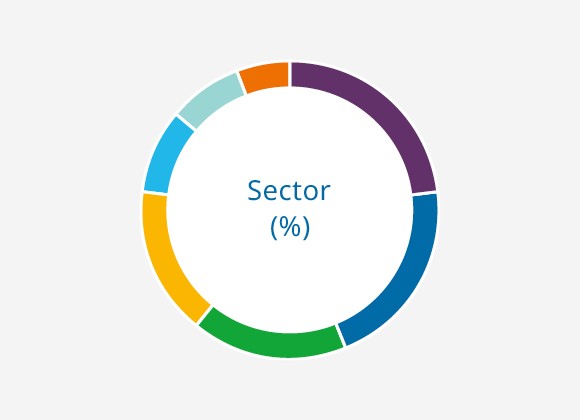
Sector (%)
-
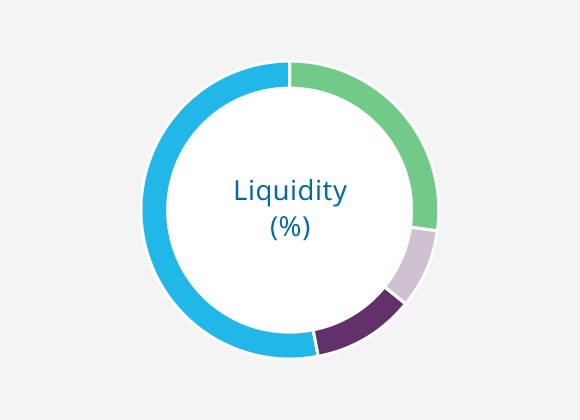
Liquidity (%)
-
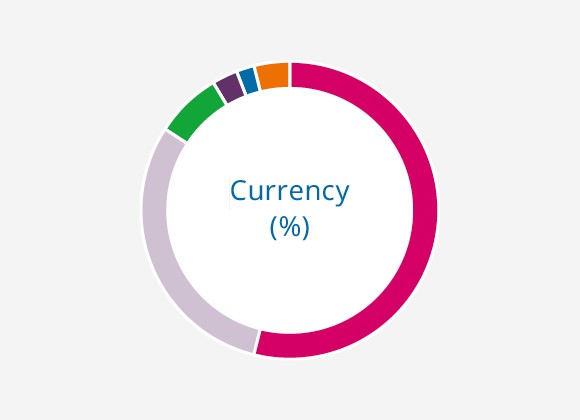
Currency (%)
-
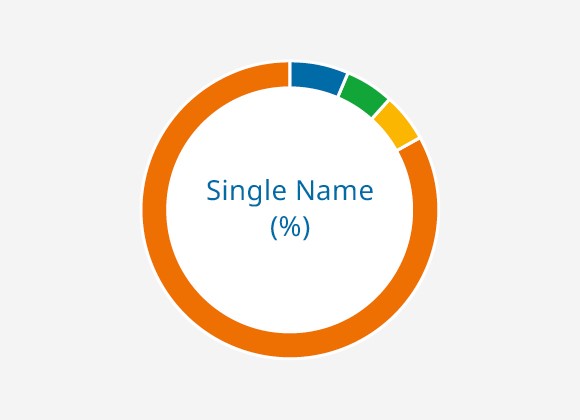
Single Name (%)
-
-
Navigating a Complex World
-
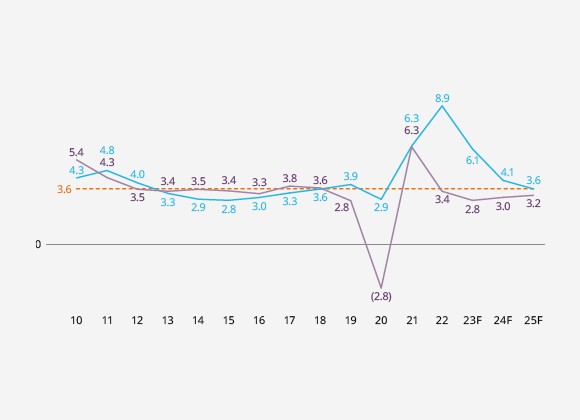
Global Real GDP Growth and Global Inflation Rate (%)
-
-
Pillars and Foundational Enablers
-
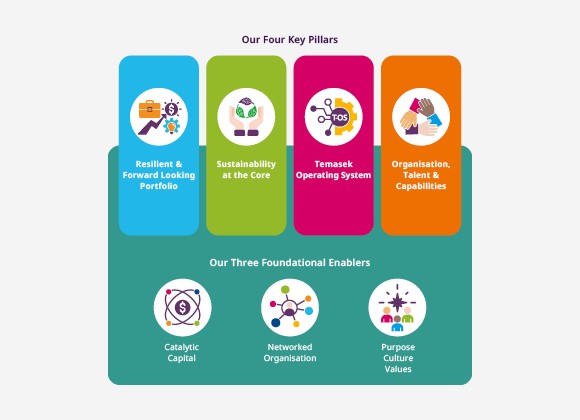
Our Four Key Pillars
-
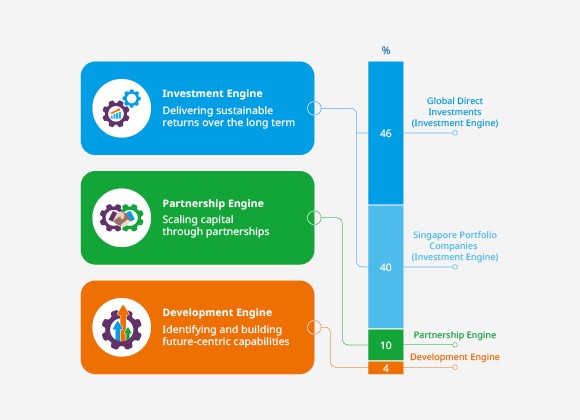
Three Growth Engines
-
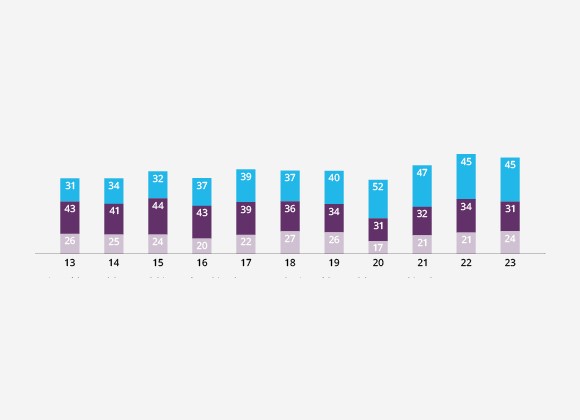
Singapore Portfolio Companies by Liquidity (%)
-
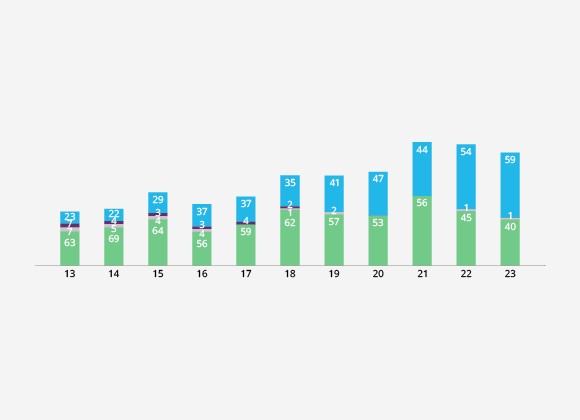
Global Direct Investments by Liquidity (%)
-
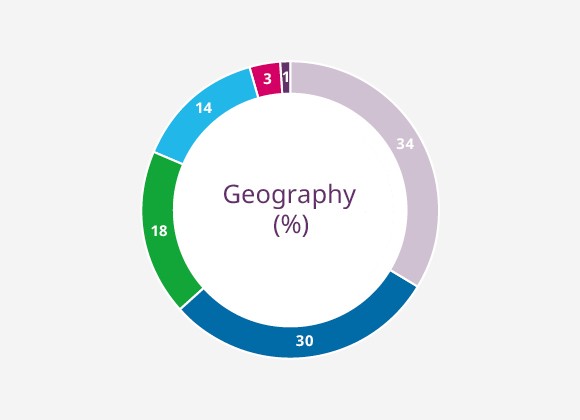
Global Direct Investments by Geography (%)
-
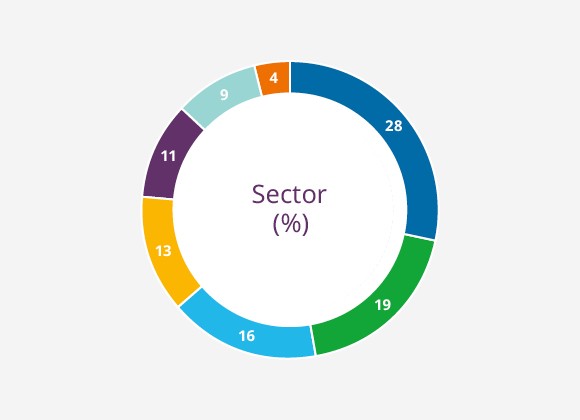
Global Direct Investments by Sector (%)
-
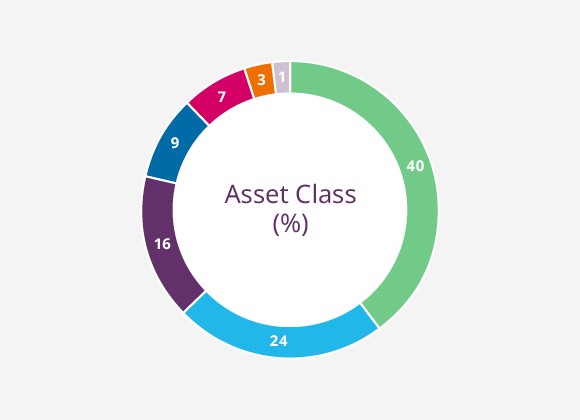
Global Direct Investments by Asset Class (%)
-
-
How We Invest
-
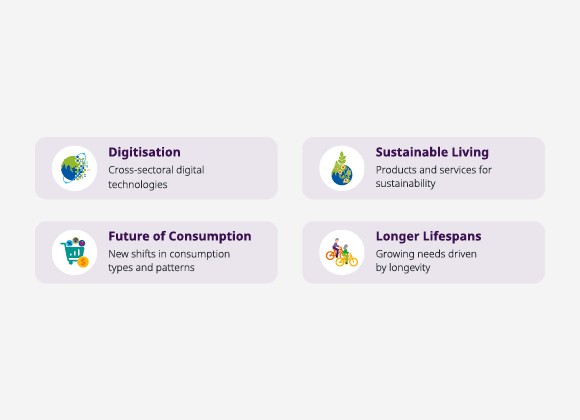
Four Structural Trends
-
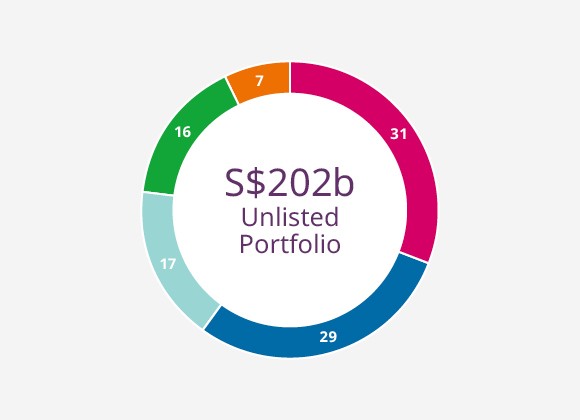
Unlisted Portfolio (%)
-
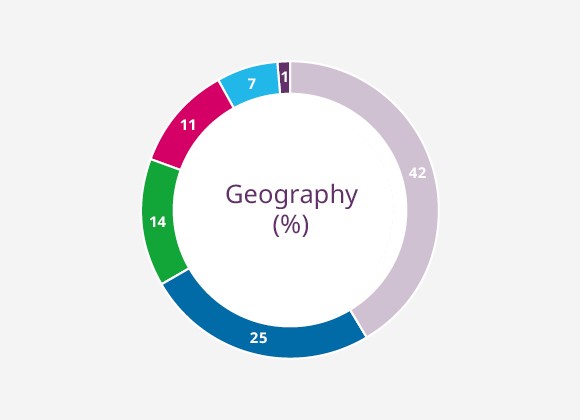
Early Stage Portfolio by Geography (%)
-
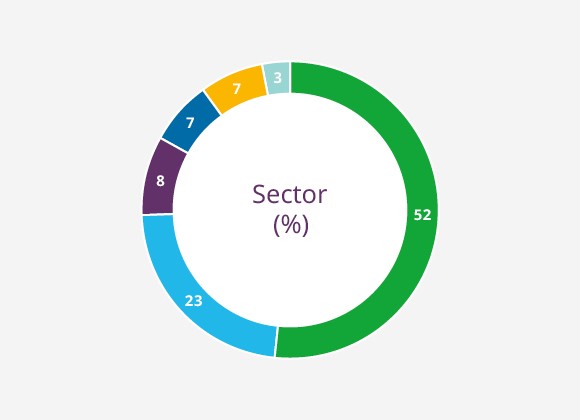
Early Stage Portfolio by Sector (%)
-
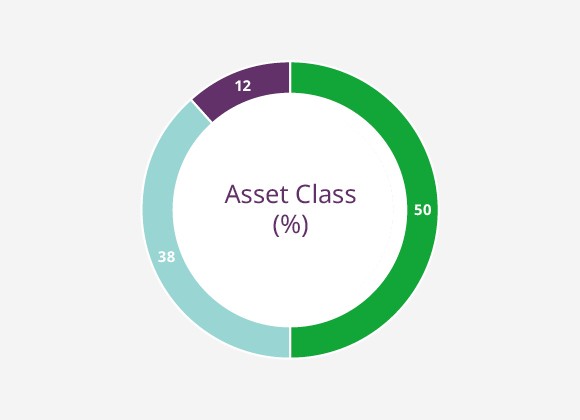
Early Stage Portfolio by Asset Class (%)
-
-
How We Grew
-
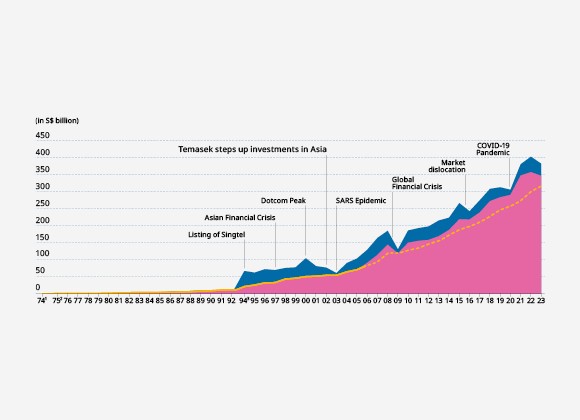
Temasek Net Portfolio Value since Inception
-
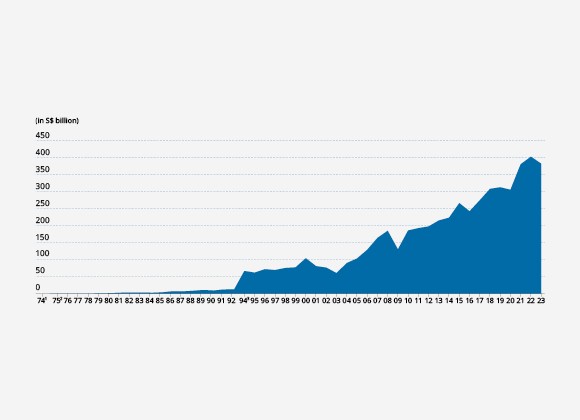
Relation between Net Portfolio Value and Total Shareholder Return
-
-
Total Shareholder Return
-
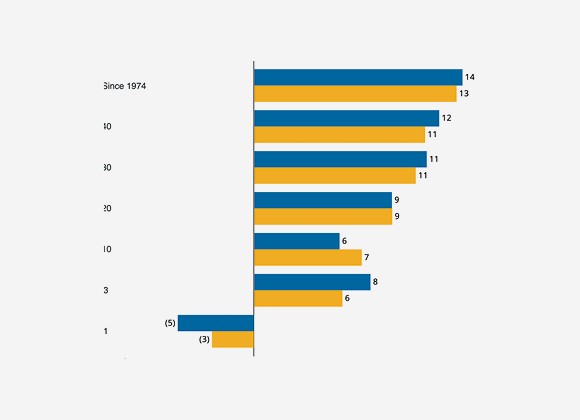
S$ Total Shareholder Return (%)
-
-
How We Manage Risks
-
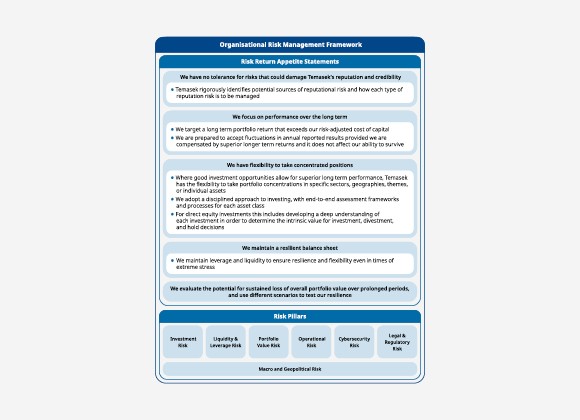
Organisational Risk Management Framework
-
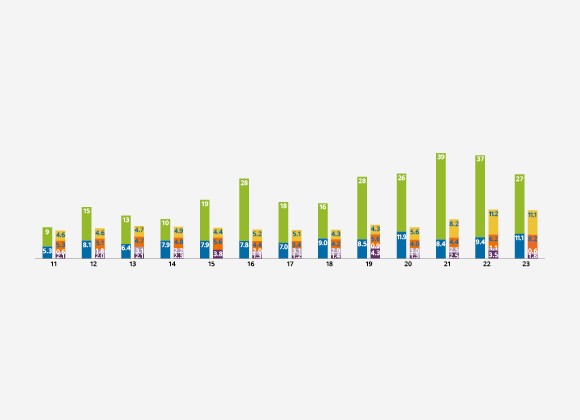
Key Recurring Income vs Debt Maturity Profile (S$b)
-
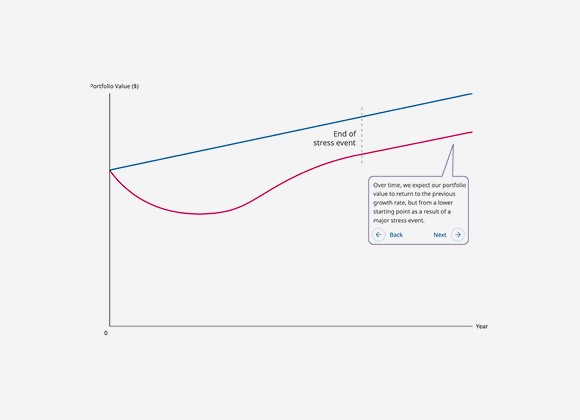
Illustration of Fundamental Earnings Impact
-
-
12-month Returns Simulation
-
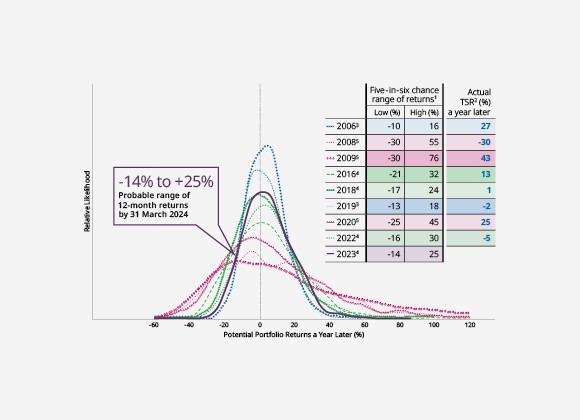
Simulation of 12-month Forward Portfolio Returns
-
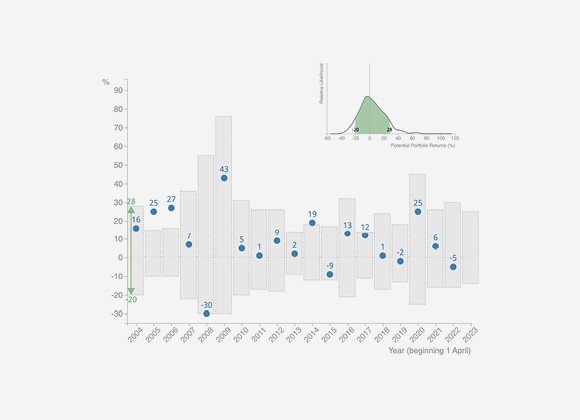
Volatility of Returns
-
-
20-year Returns Outlook
-
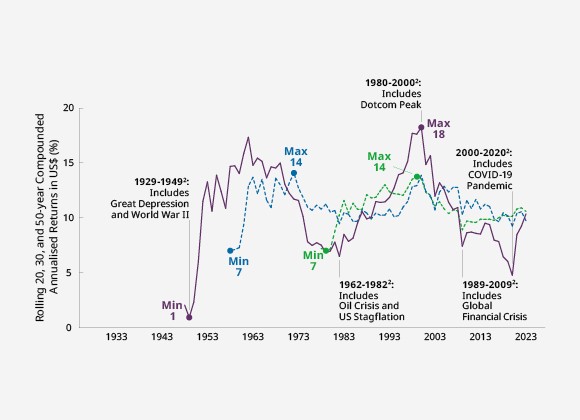
US Equity Rolling 20, 30, and 50-year Returns over Time (Compounded Annualised)
-
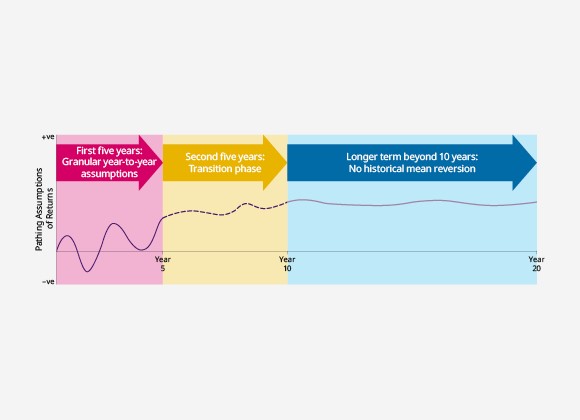
Economic Scenario Pathing (Illustrative)
-
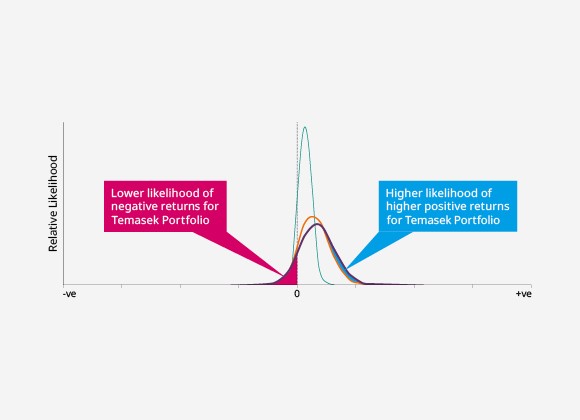
Likelihood of Geometric Returns (Compounded Annualised) at the End of 20-year Period, by Portfolio Mix
-
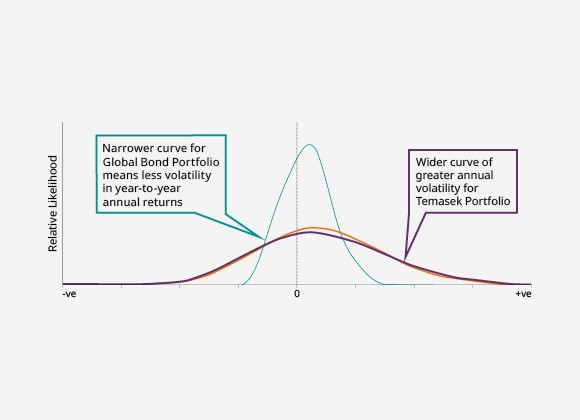
Likelihood of Year-to-year Annual Returns during 20-year Period, by Portfolio Mix
-
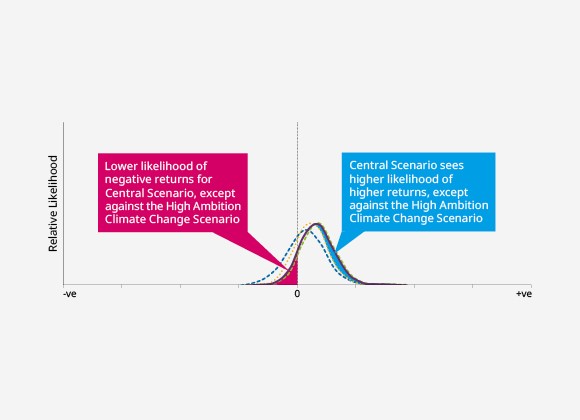
Likelihood of Geometric Returns (Compounded Annualised) at the End of 20-year Period, by Potential Scenario
-
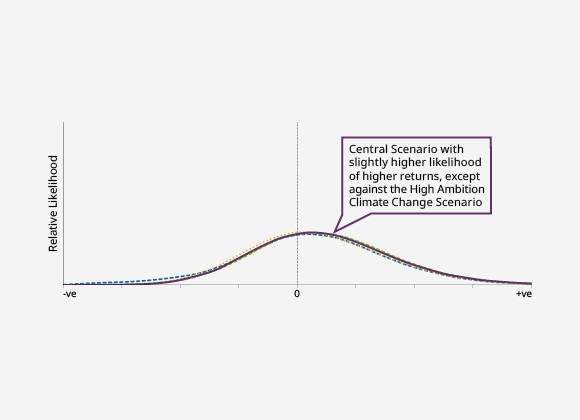
Likelihood of Year-to-year Annual Returns during 20-year Period, by Potential Scenario
-
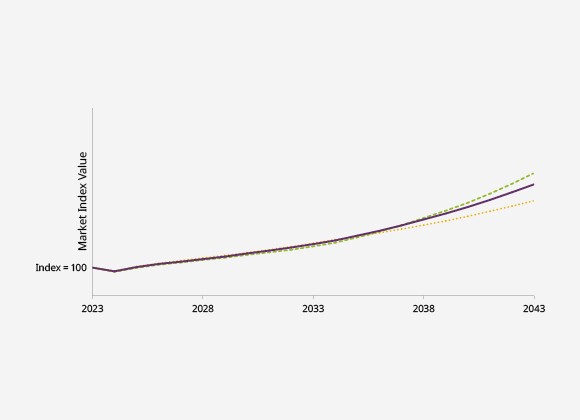
Market Index Value at the End of 20-year Period, by Potential Scenario (US)
-
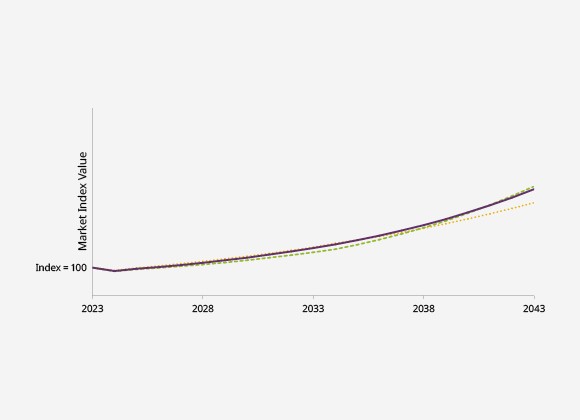
Market Index Value at the End of 20-year Period, by Potential Scenario (Eurozone)
-
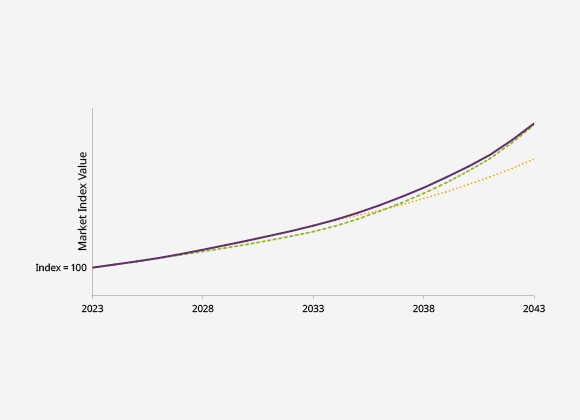
Market Index Value at the End of 20-year Period, by Potential Scenario (China)
-
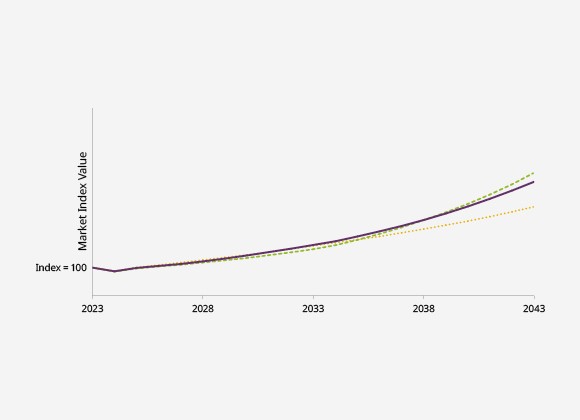
Market Index Value at the End of 20-year Period, by Potential Scenario (Singapore)
-
-
Credit Profile
-
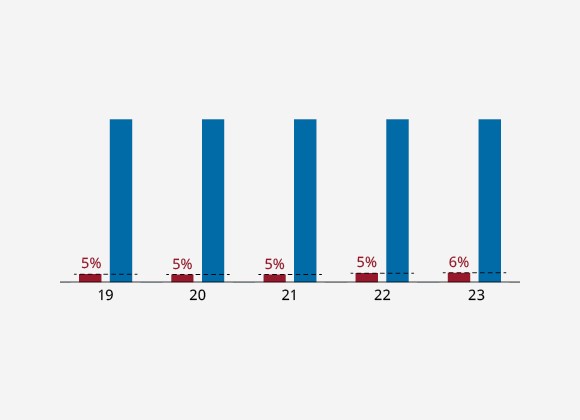
Total Debt 6% of Net Portfolio Value
-
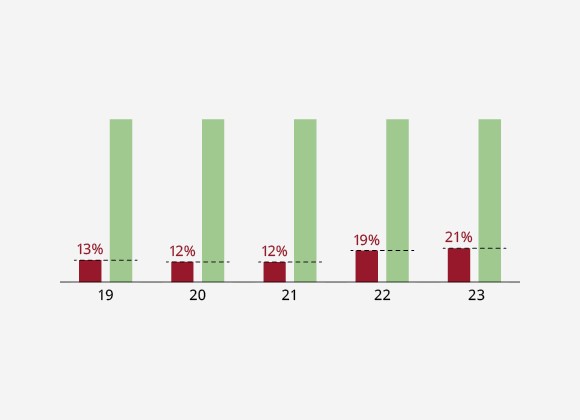
Total Debt 21% of Liquid Assets
-
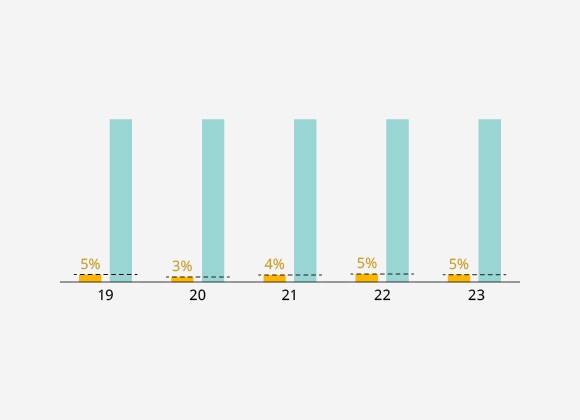
Interest Expense 5% of Dividend Income
-
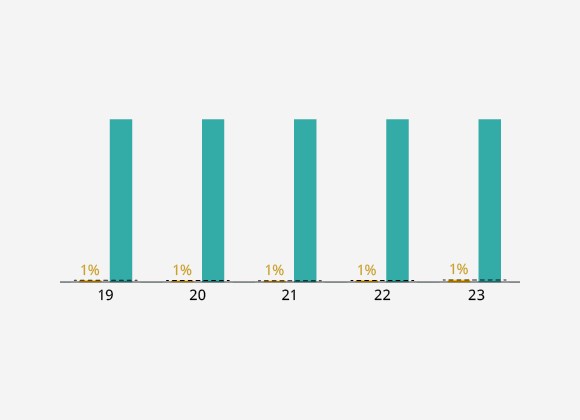
Interest Expense 1% of Recurring Income
-
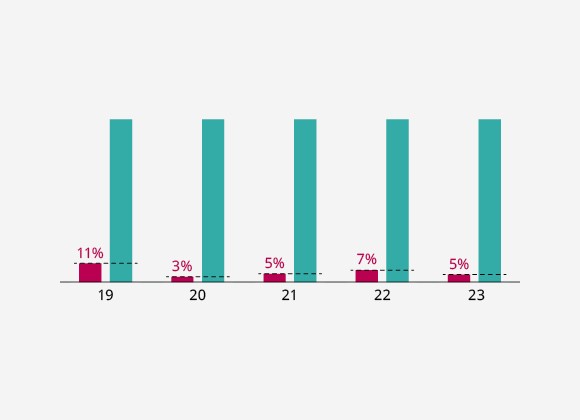
Total Debt due in One Year 5% of Recurring Income
-
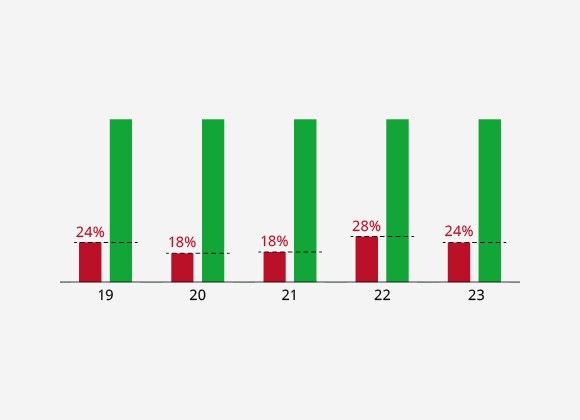
Total Debt due in next 10 Years 24% of Liquidity Balance
-
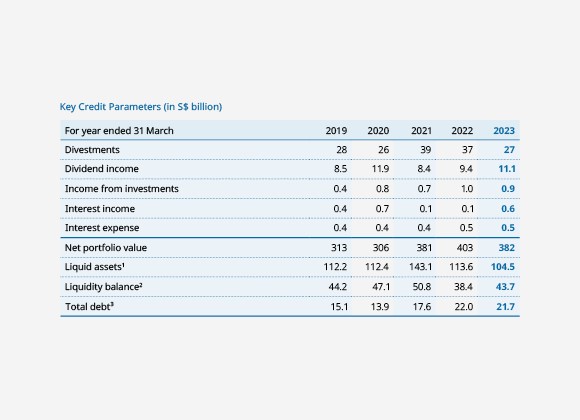
Key Credit Parameters (in S$ billion)
-
-
Temasek Bonds
-
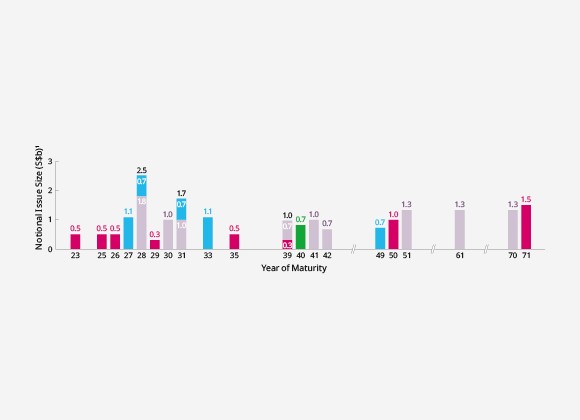
Temasek Bonds - Maturity Profile
-
-
Engaging our Portfolio Companies
-
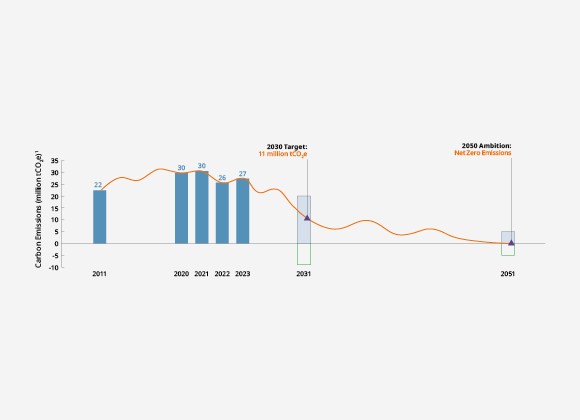
Towards Net Zero
-
-
Fostering Sustainability in Temasek
-
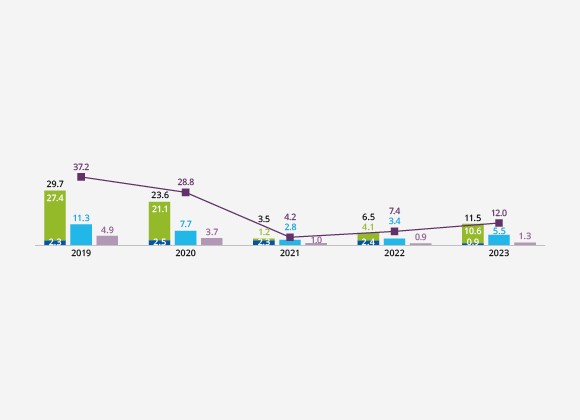
Five-year Environmental Footprint
-
-
Sustainability Indicators
-
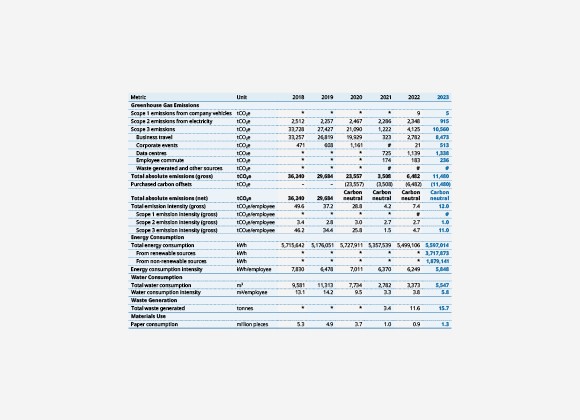
Sustainability Indicators: Our Operations
-
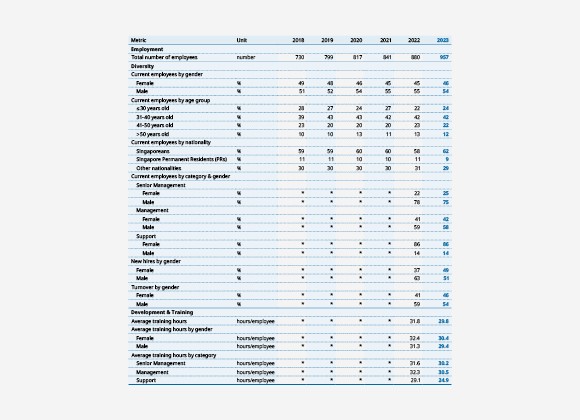
Sustainability Indicators: Our People
-
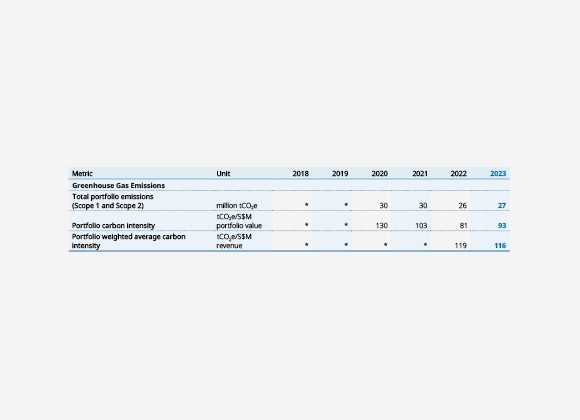
Sustainability Indicators: Our Portfolio
-
-
Wealth Added
-
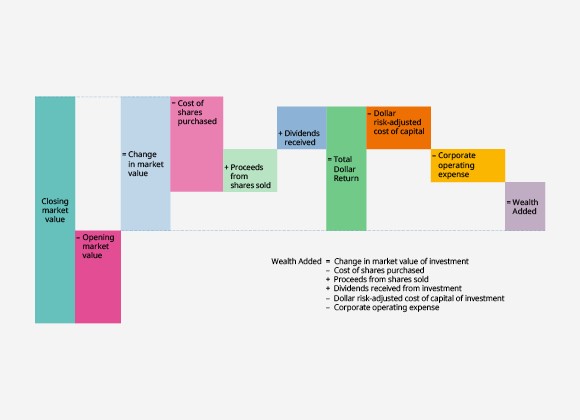
Illustration of Wealth Added
-
-
Instilling Ownership
-
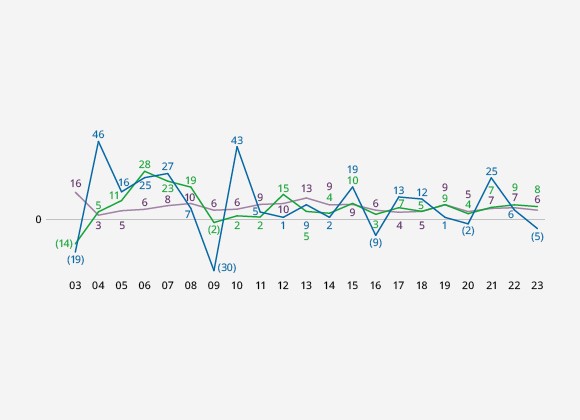
Rolling S$ Total Shareholder Return (%)
-
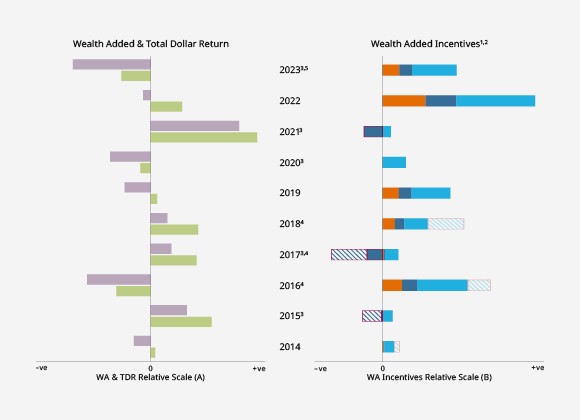
WA Incentives of Key Team
-
-
Our MERITT Values
-
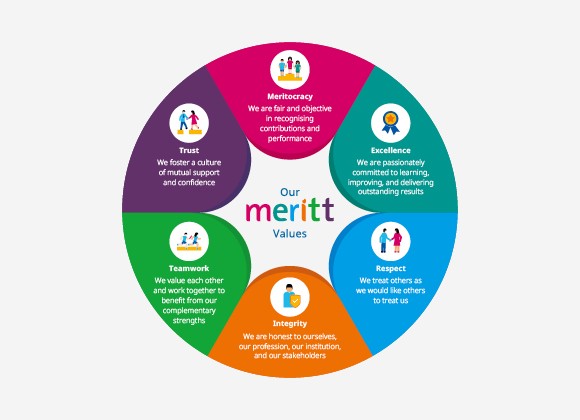
Our MERITT Values
-
-
Our Temasek Heartbeat
-
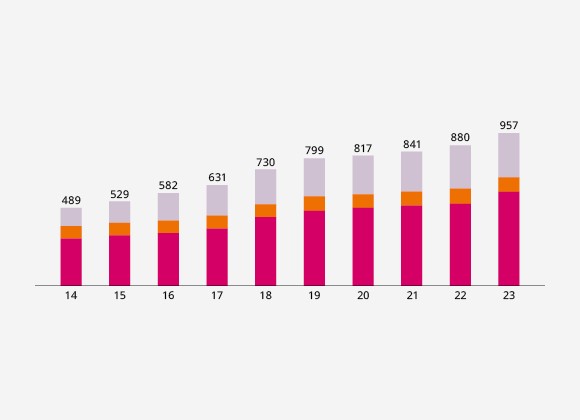
Our Staff by Nationality - Global
-
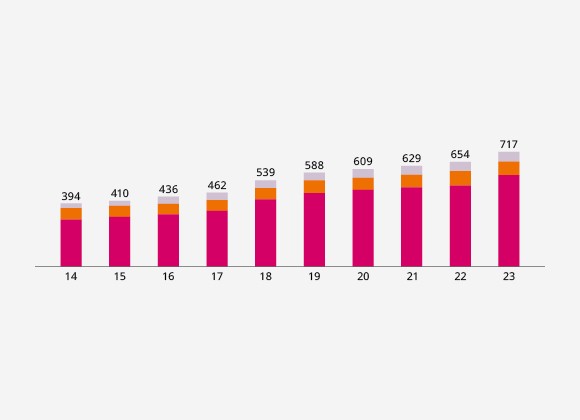
Our Staff by Nationality - Singapore
-
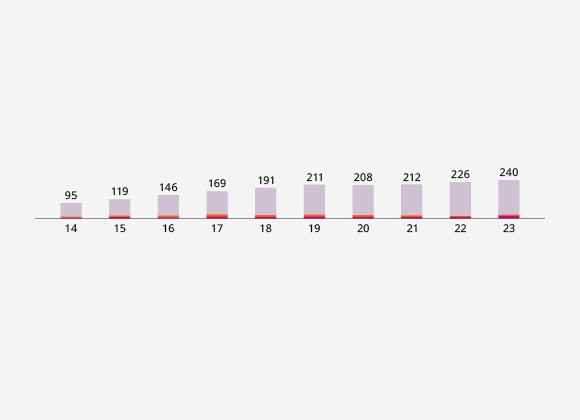
Our Staff by Nationality - Outside of Singapore
-
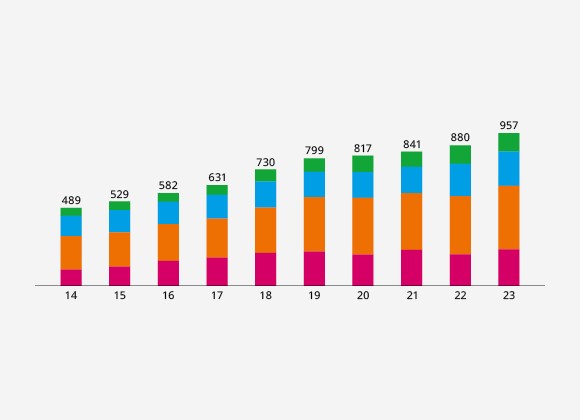
Our Staff by Age - Global
-
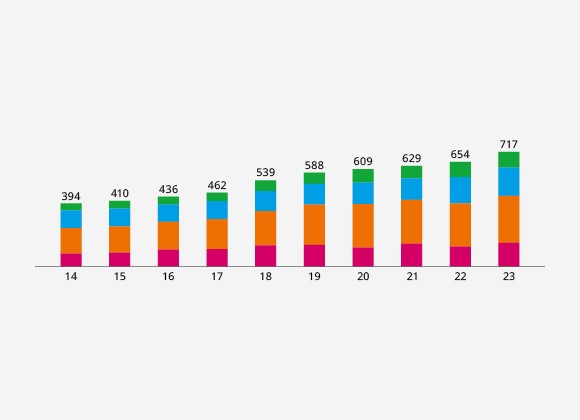
Our Staff by Age - Singapore
-
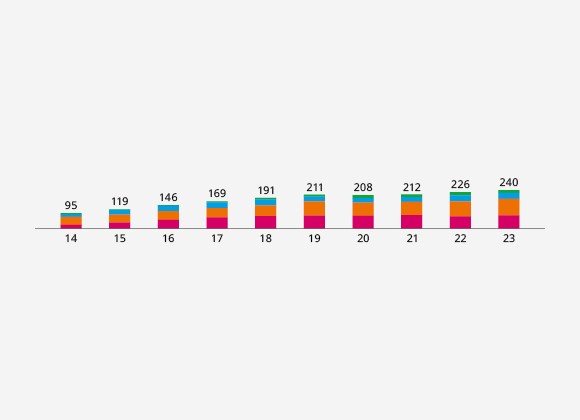
Our Staff by Age - Outside of Singapore
-
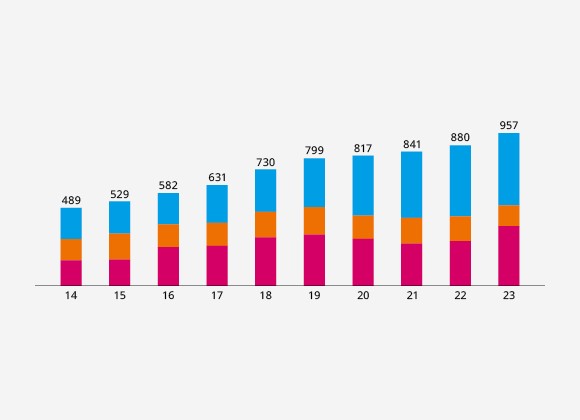
Our Staff by Tenure - Global
-
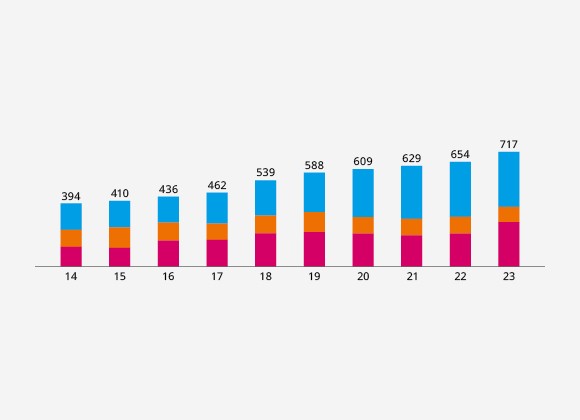
Our Staff by Tenure - Singapore
-
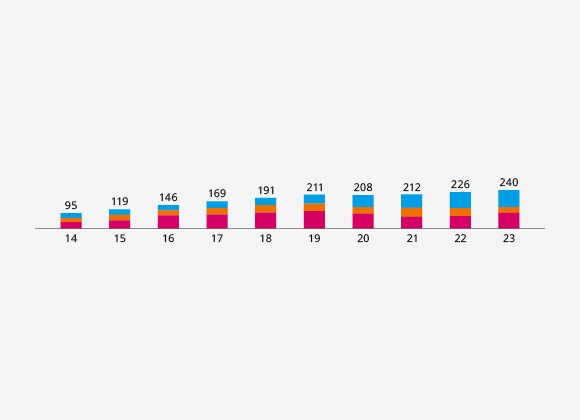
Our Staff by Tenure - Outside of Singapore
-
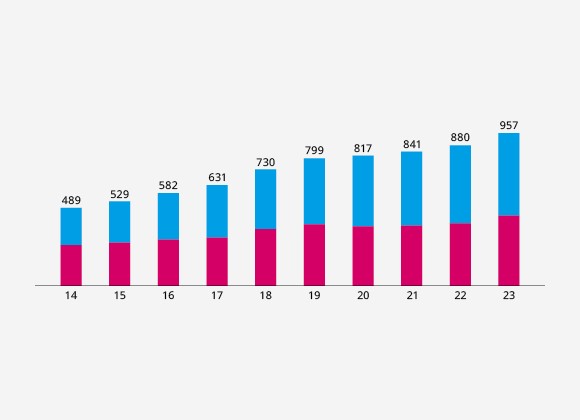
Our Staff by Gender - Global
-
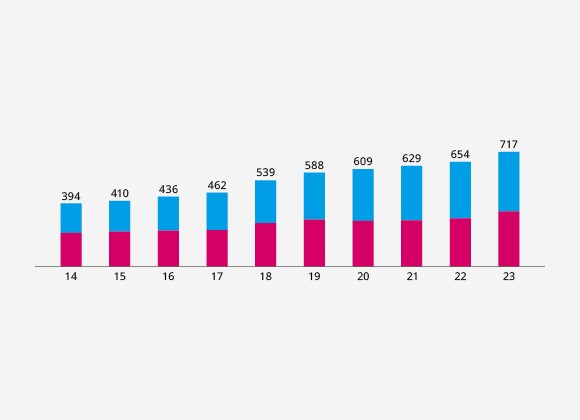
Our Staff by Gender - Singapore
-
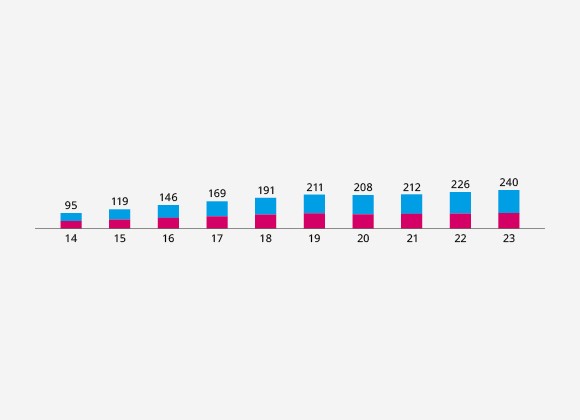
Our Staff by Gender - Outside of Singapore
-
-
A Trusted Steward
-
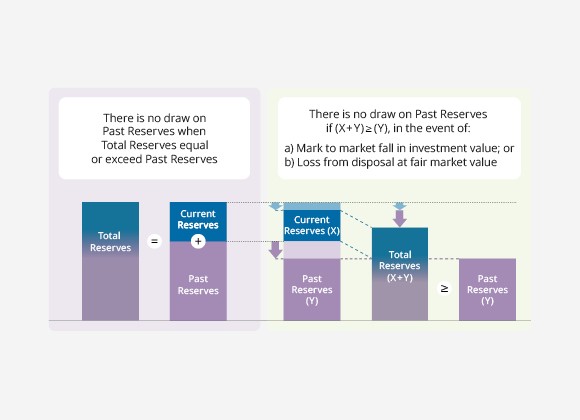
Protection of Temasek's Past Reserves
-
-
Fostering Stewardship and Governance
-
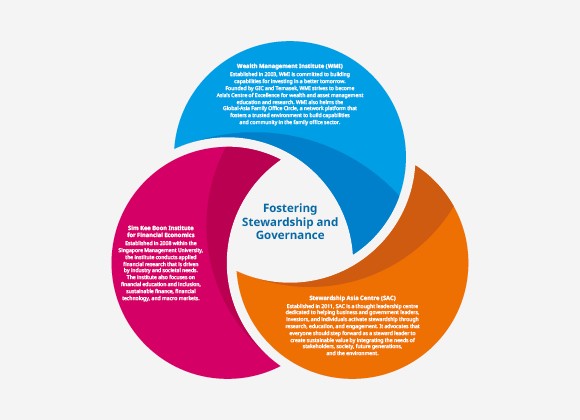
Fostering Stewardship and Governance
-
-
Enabling a Better World
-
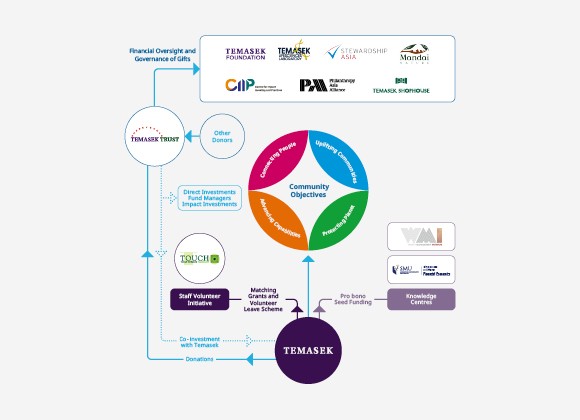
Enabling a Better World
-
-
Our Major Investments
-

Our Major Investments
-
-
Adopting International Accounting Standards
-
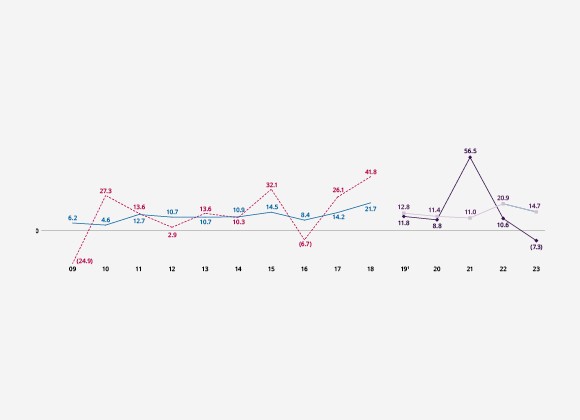
Group Net Profit/(Loss) (S$b) with and without Unrealised Gains or Losses of Sub-20% Investments
-
-
Group Financial Summary
-
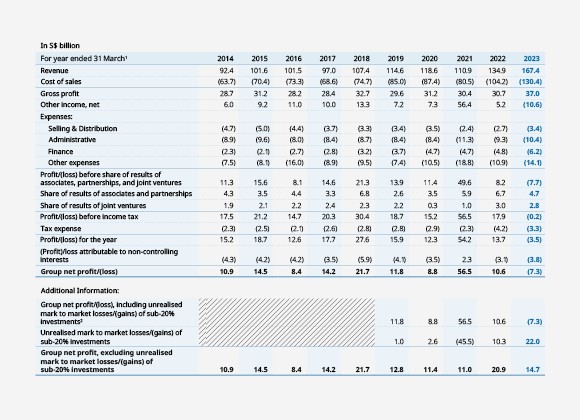
Group Income Statements
-
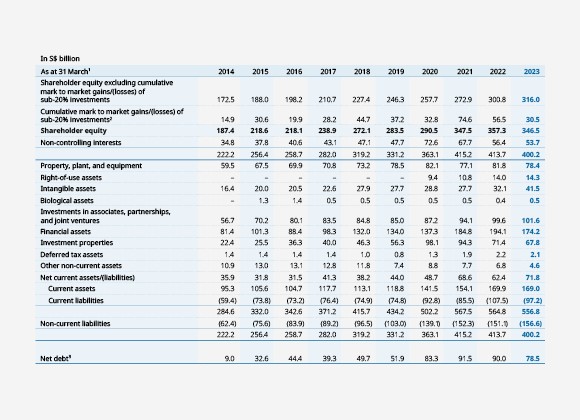
Group Balance Sheets
-
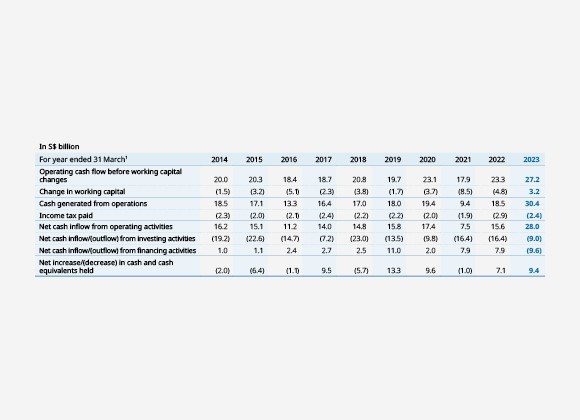
Group Cash Flow Statements
-
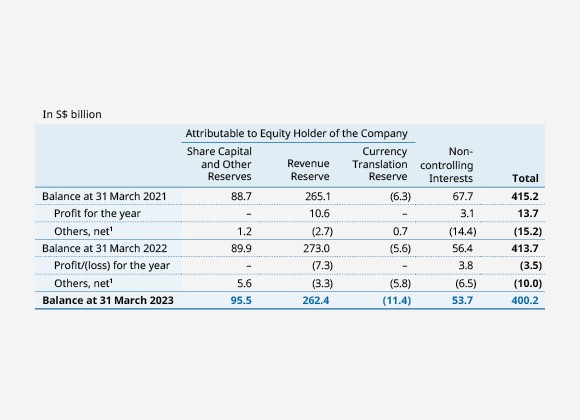
Group Statements of Changes in Equity
-
